Advanced Networking
ELEC-E7321
Wireshark and Mininet
Wireshark is a tool that captures network packets near the network interface, and provides different kinds of analysis tools for the network traffic. In addition to real physical network interfaces, Wireshark can also process virtual interfaces, such as those in Mininet.
When launching Wireshark in Mininet console, one needs to specify the virtual
node where the capturing is done. When analyzing network data with
acknowledgments, such as TCP, it makes a difference where the measurement point
is. If you capture the traffic near the data sender, it is easier to see the
effect of round-trip times and retransmissions in the transfer. For example,
assuming the simple topology introduced in the environment setup instructions,
we can launch wireshark on node rh1 in the following way:
rh1 wireshark &
Or, if an xterm session was launched for rh1, then just wireshark & is enough.
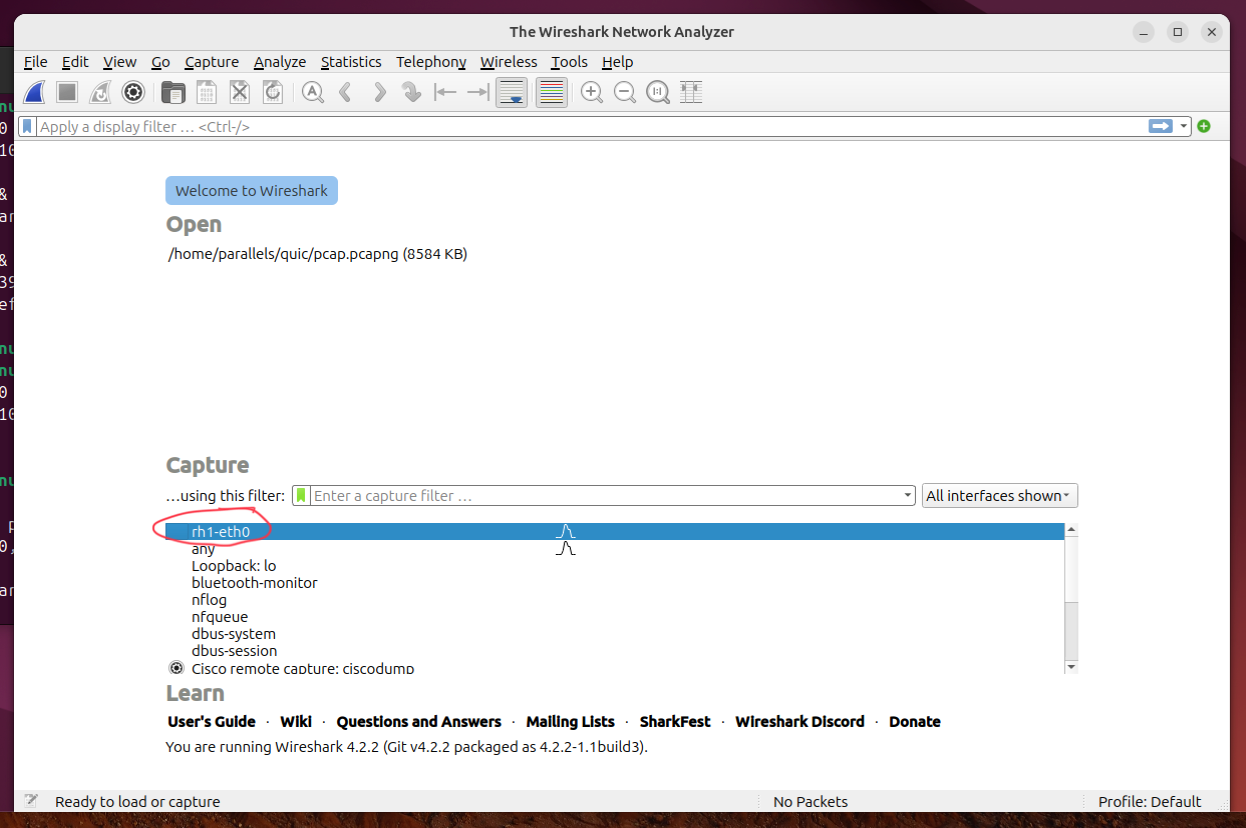
After Wireshark is started, it shows the start-up view. In the bottom side of
the window, there is a list of network interfaces from which capturing can be
done. In this case (and in the assignments), we are interested in inteface
rh1-eth0, which is the emulated Ethernet interface in node rh1. Clicking on
the Interface name starts capturing traffic.

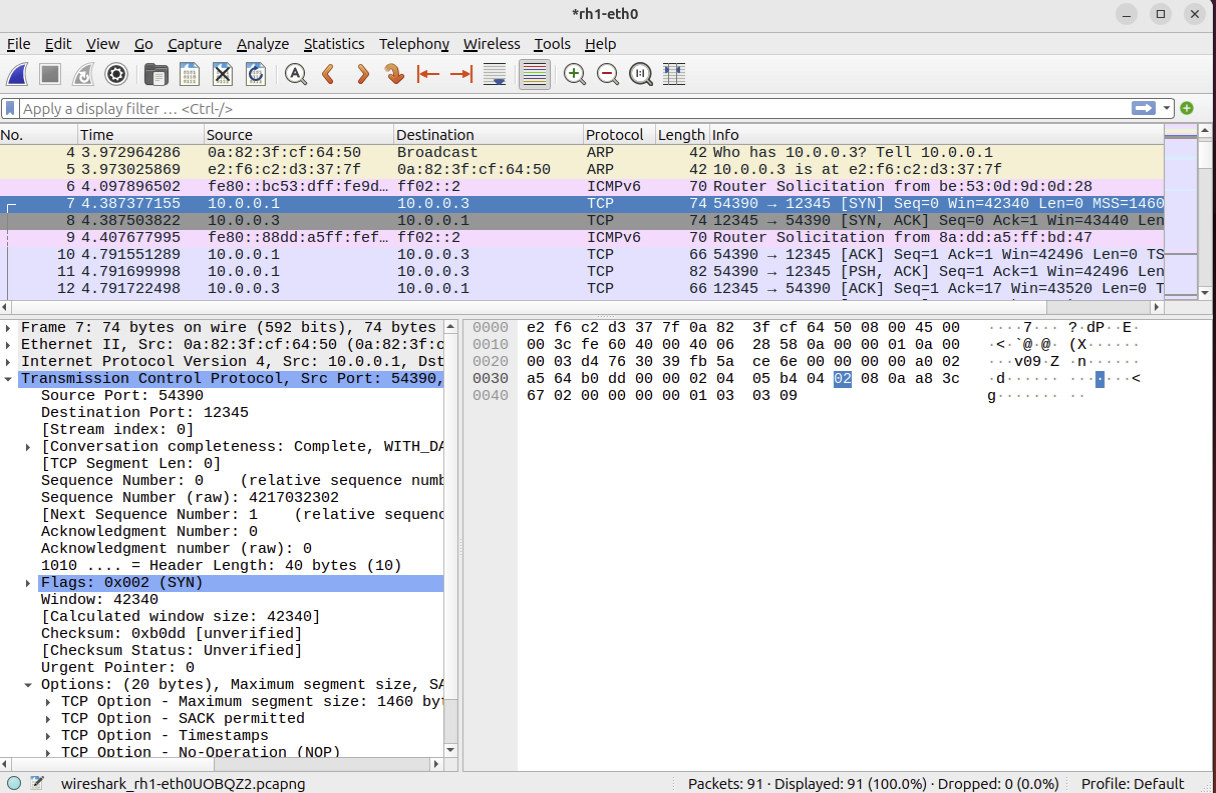
After capturing starts, a different view opens where packets start to arrive as they appear on the selected wireless interface. The top side of the window shows each packet on a separate row, along with the timestamp relative to start of the capture session, source and destination address, protocol and some additional data, for example, in the case of TCP, helping to identify the stream based on source and destination ports. It is good to pay attention on who is sender and receiver on which row. This helps separating data traffic from acknowledgments.

When one of the rows is clicked, the detailed information of that packet is shown in the bottom of the window. The left side parses open each layer of the protocol stack in use, and the right side shows same information as raw byte dump.
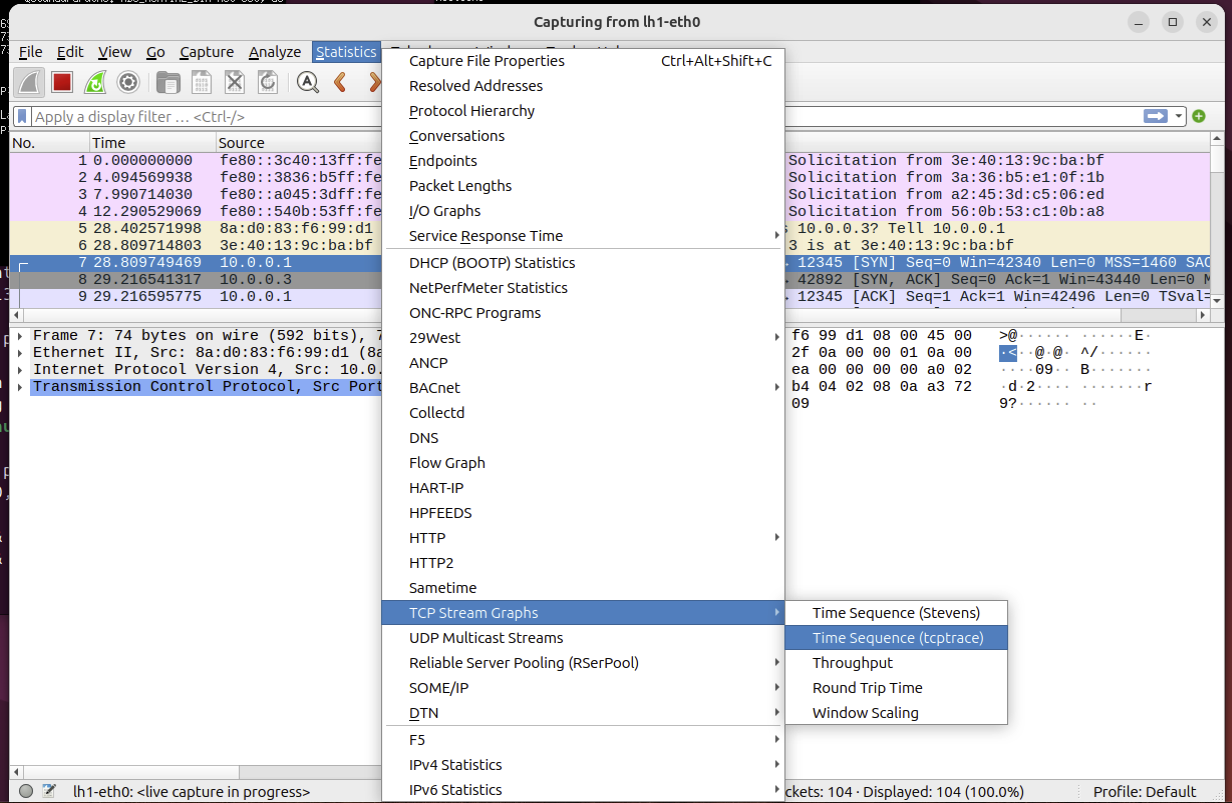
The direct packet dump is often difficult to analyze, as normally hundreds of packets are sent and received in a short amount of time. Fortunately Wireshark integrates tools that help in analysis. When analyzing the progress of TCP stream, tcptrace time-sequence graph can be useful. It shows the progress of selected connection on time-sequence diagram. You can find it from the “Statistics” menu.

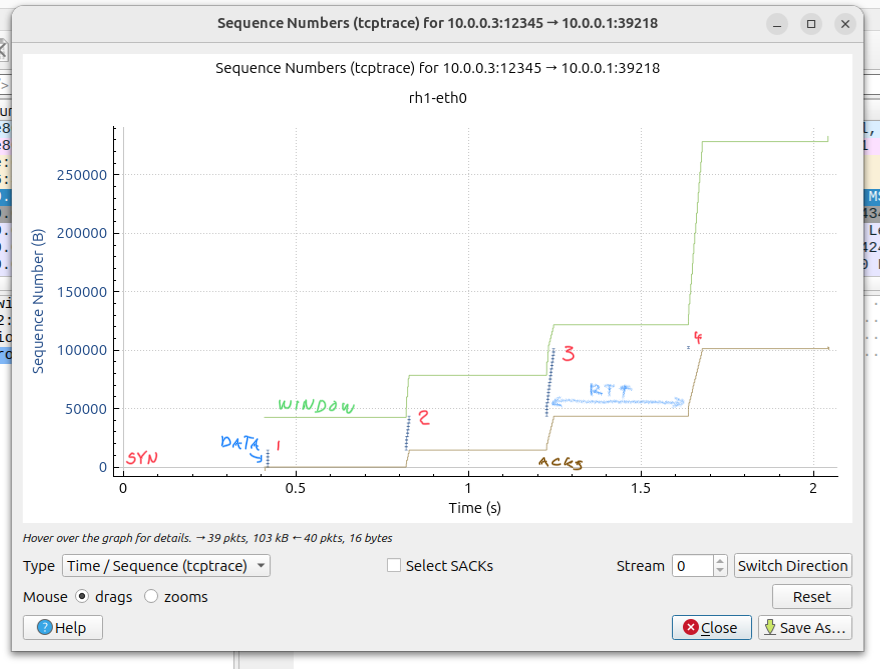
The tcptrace shows the progression of TCP data segments, acknowledgments and size of receiver’s advertised window over time. The distance between data packet and respective acknowledgment on the same vertical level tells how long the round-trip time between the data packet and acknowledgment on the connection path is. In the below picture we can see that after initial SYN handshake, the data transmission has required four RTTs before everything was transmitted. It seems that the TCP sender was in slow-start throughout the connection, doubling the amount of data sent for each round-trip time. With a bit of zooming, we can also see that at the second RTT the congestion window was 10 segments, and on the third RTT it was 20 segments. Because the RTT is so long, it seems that there is a lot of time between data and respective acknowledgment during which no data is sent. Apparently there would have been room for even larger congestion window, but TCP’s slow start prevented efficient use of the link.

Note that if we had taken the trace from the receiving side of the TCP connection, i.e. 10.0.0.1 (lh1), in this this case, we would not have been able to determine the round-trip time. If there is lots of detail in the graph, as there often is, it is possible to zoom and pan the view for closer look.
If there were retransmissions, for example fast retransmits because of three duplicate acknowledgments, one can see them on the graph. Also the packet view highlights retransmissions with a different color so they can be more easily seen.